The Tragic Tale of the Big Bankers Who Couldn’t
As if with one voice, a single tragic tale has dominated the financial news over the past week.
The world’s central bankers apparently are demoralized over their failure to drive the world into recession. The Wall Street Journal, echoing essentially the entire financial press, reports that the strength of the economy has confounded “predictions from the World Bank and other economists that the global economy was set for one of its weakest years in recent decades.”
This may persuade “central bankers that they need to raise key interest rates further” to pour “more cold water on an economy that is still running a little too hot.”
Upsetting the bankers is not only that more people are finding jobs, but their wages are going up!
As the WSJ explained, “a key indicator for central banks is the job market which remains tight in many parts of the world. Policy makers have been scrutinizing labor market data for hints of rising unemployment, a drop in hours worked, or a slowdown in wage rises — all of which could help cool demand and ease upward price pressure but remain elusive.”
Particularly disheartening was January’s outrageous 0.9% rise in wages and salaries, almost double the rise in prices. If this can’t be stopped, workers might make up the ground they’ve been losing since 2021!
How can we avert this global catastrophe, the bankers ask?
Our happy guess is that they can’t.
Supposedly, the Fed’s most powerful weapon is its “policy rate,” the overnight interbank lending rate, a.k.a., the Fed Funds rate. Yet for at least the past 40 years, correlations between that rate and inflation have been unimpressive.
More embarrassingly yet, over the same period, there is remarkably little correlation between the policy rate and other more economically meaningful rates set by markets. As we noted in this space last week, neither the 10-year treasury, nor investment grade corporate bonds, high-yield bonds, nor even mortgage rates appear to care very much about the bureaucrats’ rate.
This a problem, but for the Fed, not the rest of us, because as all the central banker caterwauling suggests, the bankers believe their principal weapon against inflation is putting people out of work, which they hope will cause a contraction in credit and a shortage of money, pushing currencies up and prices down.
Why did we ever believe they had this power?
Blame the great Volcker myth. According to the myth, former Fed Chairman Paul Volcker stopped the Nixon-Ford-Carter inflation by raising the Fed Funds rate to an extraordinary 19%, triggering a massive recession and consequent deflation.
The evidence for this is at best ambiguous. To see this, look first at Graph 1, showing the relationships between the Fed Funds rate, corporate bond yields — which are market-determined and reflect rates at which businesses borrow — and inflation.
Corporate bond maturities typically run several years and sometimes decades, and they are sensitive to the market’s view of the future. But markets don’t know any more about the future than you or the rest of us. Where information is scarce, fear gains power. When inflation appears, lenders eventually come to fear that if rates keep rising money will be lost on every loan. So, they raise rates, though often too slowly as the bankers are anchored to recent experience.
The graph confirms what this common-sense account suggests. Corporate bond yields (blue line) gently, one might almost say cautiously, follow inflation, but lag on both the way up and the way down. The volatility of corporate yields is markedly less than either the Consumer Price Index (CPI), the red line, or the Fed Funds rate, the green line. This gentle rise and fall are what one would expect as persistent inflation first gradually makes lenders cautious and inflation’s decline gradually makes it seem safe to lend again.
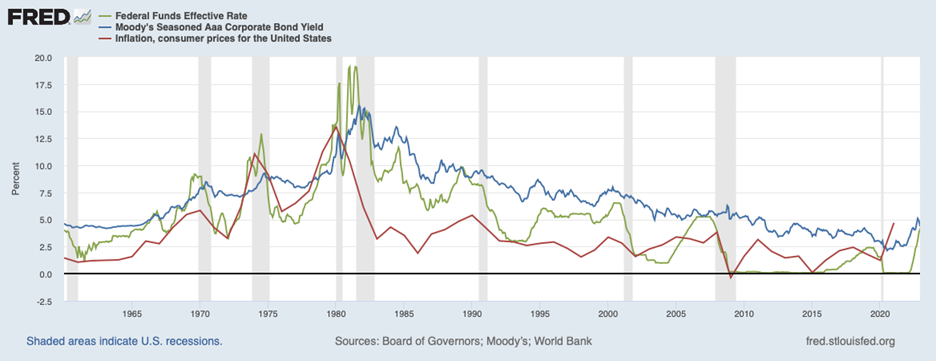
Graph 1: Inflation vs. Fed Funds and Aaa Corporates, 1960-2021
Meanwhile, the CPI and the Fed Funds rate do, to some extent, move together. But do they move in a way consistent with a causal relationship?
For it to be plausible that the Fed Funds rate is controlling the CPI, changes in the Fed rate should clearly lead changes in the CPI, with a rising Fed rate preceding a fall in inflation. That does happen sometimes, and markedly from 1980-83 when the Volcker legend was born.
Still, there are problems. For one thing, because the Fed Funds rate is a “policy rate,” correlations to inflation on the downslope are useless as a causal indicator. When inflation subsides, the Fed responds by cutting its rate; naturally the two are correlated on the way down. If anything, it is the decrease in inflation that “causes” the decrease in the Fed rate, which may be why inflation seems to lead, not lag, on the way down.
That observation throws a somewhat different light on the apparent correlations on the upslope. After all, Fed officials, believing their rate hikes can fight inflation, raise rates when inflation increases. That does not entirely resolve the lag/lead issue, but it does make us wary of attributing the rise of the Sun to the crow of the cock. It also raises the possibility that Volcker’s most drastic increases in the funds rate, circa 1981, were unnecessary since inflation was already retreating.
Finally, for almost a decade starting from 2009, any correlation between inflation and the Fed Funds rate disappears.
Nothing is proven, perhaps, but we proceed to the next graph with our skeptical antennae twitching. Strict Scrutiny, as the courts might say, seems in order.
Graph 2 charts the same variables but over a much shorter period for clarity. Glance at the blue line, which shows yields for corporate Aaa bonds. The thought that leaps to mind is “well, of course, we had a recession!” The Aaa rate is not only a rate at which businesses borrow, but also a rate available only to the strongest companies in the economy. In 1979, yields broke 10% for the first time as far back as we have data (2019). (See Graph 3 for that whole series.) And yields kept on going up to top 15%, more than 3X the typical level in the decades prior.
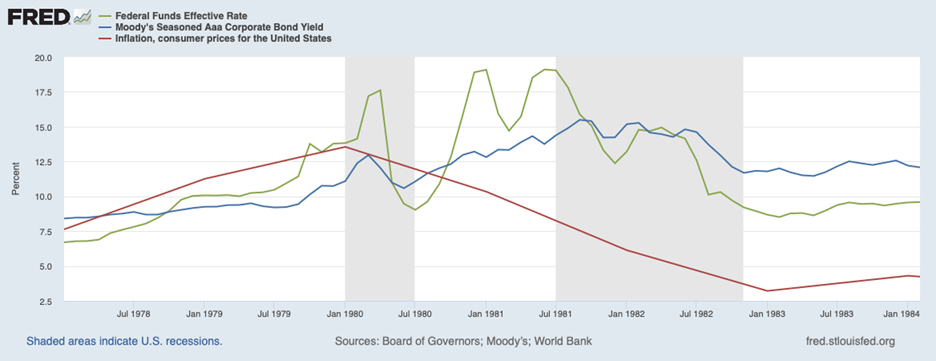
Graph 2: Inflation vs. Fed Funds and Aaa Corporates, 1977-1984
How were we to avoid recession when the strongest businesses in the country were unable to borrow at less 3X their normal rate? We don’t need Volcker or the bureaucrats’ Federal Funds rate to explain how we got into one of the longest recessions since 1929.
Inflation does not cause economic booms; it causes economic collapse. That’s what happened in 1981. Stagflation, proclaimed a paradox by the Phillips Curve crowd in the 1970s, is the normal, predictable result of undermining the currency.
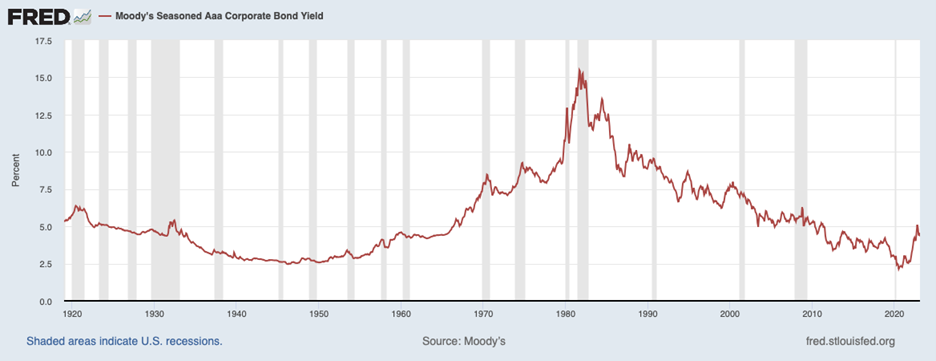
Graph 3: Aaa Corporate Yields 1919 to present
So did the 1981-82 recession cure inflation? Recessions are essentially contractions of credit so in that sense, “yes.” Credit busts follow credit booms.
But why? Or rather what is a credit boom?
During a credit boom, lots of poor investments get funded. But that does not tell us how the investments became poor or whether they were good investments originally.
The “margin” for good investment expands or contracts with economic conditions. U.S. economic conditions from 1972 through 1981 were bad and progressively worse. By the mid-1970s the combination of inflation (originally unleashed by abandoning the gold standard) and stubbornly high tax rates had pushed the after-tax return on the S&P 500 first into the low single digits and then into negative territory. Investors increasingly put their money not into productive investments but “real” assets from real estate to Rembrandts which, they hoped, would at least keep up with inflation.
As opportunities for productive investment shrunk, we increasingly had more money than opportunities. Inflation accelerated. With fewer productive outlets for our money, our money lost value.
Our friend John Tamny, a brilliantly rebellious thinker on these topics, editor of Real Clear Markets and author of The Money Confusion, a must-read if you would like to be less confused, likes to say “there can never be too much good money.” We’d add as a corollary this is because good money is evoked by good opportunities.
Contrary to libertarian fantasies lamenting that banks can expand credit at will, backed by nothing in the vault, every commercial loan or bond is backed by some collateral: the enterprise funded by the loan, often including tangible assets. Money supply expands with worthy business projects. If bad government policy renders those once promising projects unsound it will appear, after the fact, that credit had been too loose. As once-sound projects fail, a contraction will ensue. Good money can be made bad by bad policy.
Which brings us to the real question: why did inflation remain subdued for almost 40 years, from 1983 through 2021? Surely this is a far more interesting story than the confused tale of policy rates vs. economic rates; leading vs lagging inflation over a mere three years.
We had little to no inflation because the economy, thanks to mostly to President Reagan, with some credit to President Clinton, the younger President Bush and President Trump, was booming. Abundant economic opportunity created an abundance of good money. As graph 4 shows, the money supply boomed, too, growing at a much higher rate than in the Great Inflation from 1972 through 1981, during which M2 was almost flat. But it was good money and, as the good Mr. Tamny says, we can never have too much of that.
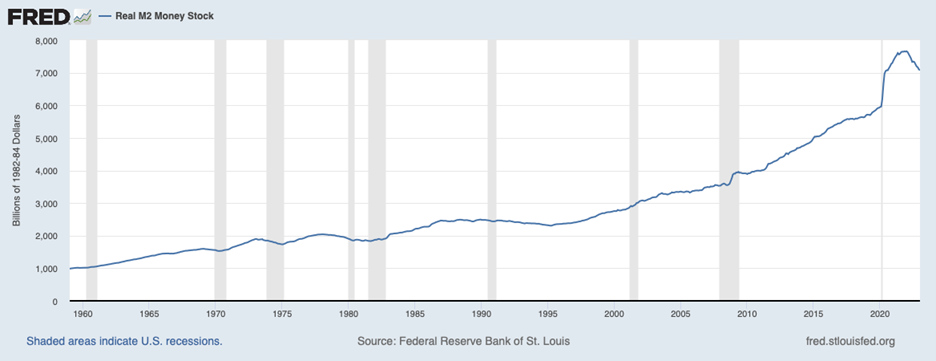
Graph 4: M2 1960 to Present
We close with a delicious comment from one Carsten Brzeski, chief economist for ING: “If the greatest monetary policy turnaround in years does not leave any marks on the real economy, we could also close all central banks.”
OK.
P.S. As an added benefit to being part of the Eagle Family now, our new publisher worked with Regnery to offer you a special discount on four of George’s books! You will receive a 50% discount by clicking here. But hurry, this offer is expiring on March 31.